Mental Computation Using Likelihood Ratios
The "Heart Attack in New Jersey" Method
I. Introduction
It's hard to compute a post-test probability using a likelihood ratio and the pre-test probability.
The October 2006 issue of Evidence
Based Medicine describes a simplified method
that gives exact results in most clinical circumstances. Most physicians will
be able to make the entire computation in their head.
This web page supplies the mathematical proof for the new method and provides
graphs that show the error of the method.
II. Mathematical Proof
Introduction. To update diagnostic probabilities after diagnostic testing, a clinician classically:
- Starts with P, the pre-test probability of disease;
- Looks up L, the likelihood ratio associated with the diagnostic test's result;
- Converts P from a percentage to a ratio, R.
- Calculates a new ratio, R', by multiplying L times R.
- Converts R' to a percentage, P', which is the post-test probability.
The conversion in step (3) is performed with the formula:
The conversion in step (5) is performed with the formula:
Claim. A new, "quick" method claims that
P' = mi / (mi + nj)
when
m = 10*P
n = 10-m
i = numerator of L
j = denominator of L
The result for P' is exactly correct when m is an integer. In other cases, m should be rounded to an integer.
Proof. The quick method assumes that the pre-test probability is always a multiple of 10%, i.e. 10%, 20%, ..., 80%, 90%. (Pre-test probabilities of 0% or 100% can be ignored because no diagnostic test can change them.)
The list of pre-test percentages above can be rewritten as m*10%, where m is an integer between 1 and 9 inclusive and * is the symbol for multiplication. The percentages can be expressed in probability form as m/10, since 10% = 1/10.
Derivation of the quick method's computational algorithm begins by substituting P = m/10 into equation [A]:
| R = (m/10) / ( 1 - (m/10) ) | |
| R = m / (10 - m) | |
| R = m/n, where n = 10-m | [C] |
Substituting the value of R from equation [C] into the classic algorithm's step (4) yields:
| R' = L * (m/n) = mL / n | [D] |
where mL means m*L.
To convert the ratio R' to a probability, equation [D] is substituted into equation [B]:
| P' = R' / (1 + R') | [B] |
| P' = (mL/n) / (1 + (mL)/n) | |
| P' = mL / (n + mL) | [E] |
Equation [E] defines the quick method. It is a simple equation that expresses the post-test probability as a function solely of the pre-test probability and the likelihood ratio.
If L is a rational number such that L=i/j, then substituting into [E] yields:
| P' = mi/j / (n + mi/j) |
| P' = mi / (nj + mi) | [F] |
Q.E.D.
Corollary. The proof above can also be used when m is a multiplier of 1%. In that case, n should be redefined as 100-m. We refer to 10 and 100, as the case may be, as the "quantum" for the quick method.
III. Figures

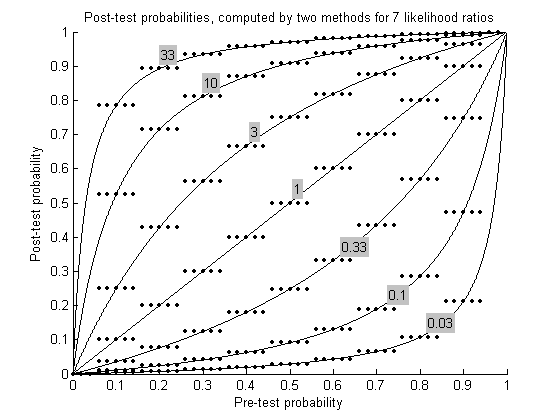
Figure 1. Post test probabilities, computed by two methods for 7 likelihood ratios.
For each likelihood ratio (labeled in gray boxes) the classic method (solid lines) and the quick method (dots) are used to calculate post-test probabilities for a range of pre-test probabilities. Ideally, all dots would lie atop their corresponding line. However, the quick method provides exact results only for pre-test probabilities evenly divisible by 0.1. At other probabilities, the quick method's error is the vertical distance between a dot and its corresponding line.
Not shown: The error could be reduced for pre-test probabilities that are not a multiple of 0.1 by (a) rounding the pre-test probability to a multiple of 0.1, (b) calculating from it a post-test probability using the quick method, (c) adding the change in probability computed by the quick method to the original, un-rounded pre-test probability.

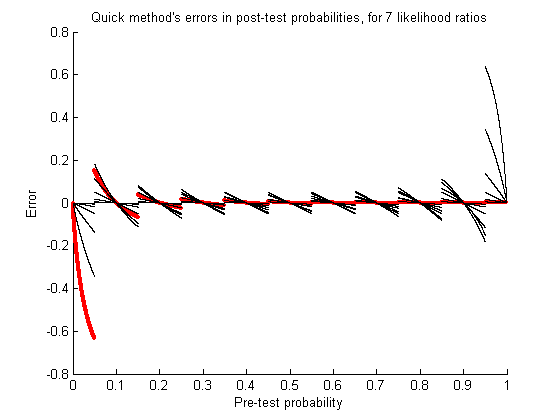
Figure 2. Errors of the quick method in calculating post-test probabilities, for 7 likelihood ratios (LRs).
Error is defined as the post-test probability computed by the quick method minus the post-test probability computed by the classic method. Line segments are plotted for each LR. The LRs are the same as in Figure 1. The thick red line segments correspond to LR = 33 (most noticeable at lower left). In general, the quick method's extreme error occurs when the LR and the pre-test probability lie at opposite extremes of their ranges. Otherwise, almost all errors between pre-test probabilities of 0.05 and 0.95 have magnitude less than 0.1. The error is zero whenever the pre-test probability is evenly divisible by 0.1.

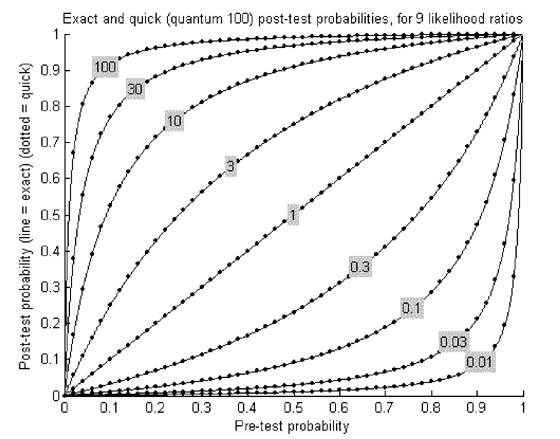
Figure 3. Errors of the quick method in calculating post-test probabilities, for 9 likelihood ratios (LRs) when the quantum is 100.
Layout of this figure is similar to Figure 1. Here, however, the quick method has been modified as described in the Corollary. That is, the quantum is 100, as opposed to 10 in the prior figures. The error is zero whenever the pre-test probability is evenly divisible by 0.01, even at extreme values of pre-test probability and LR. In this figure the dots occur at pre-test probability intervals of 0.02.
## End ##
|


